Finance dashboard & analytics
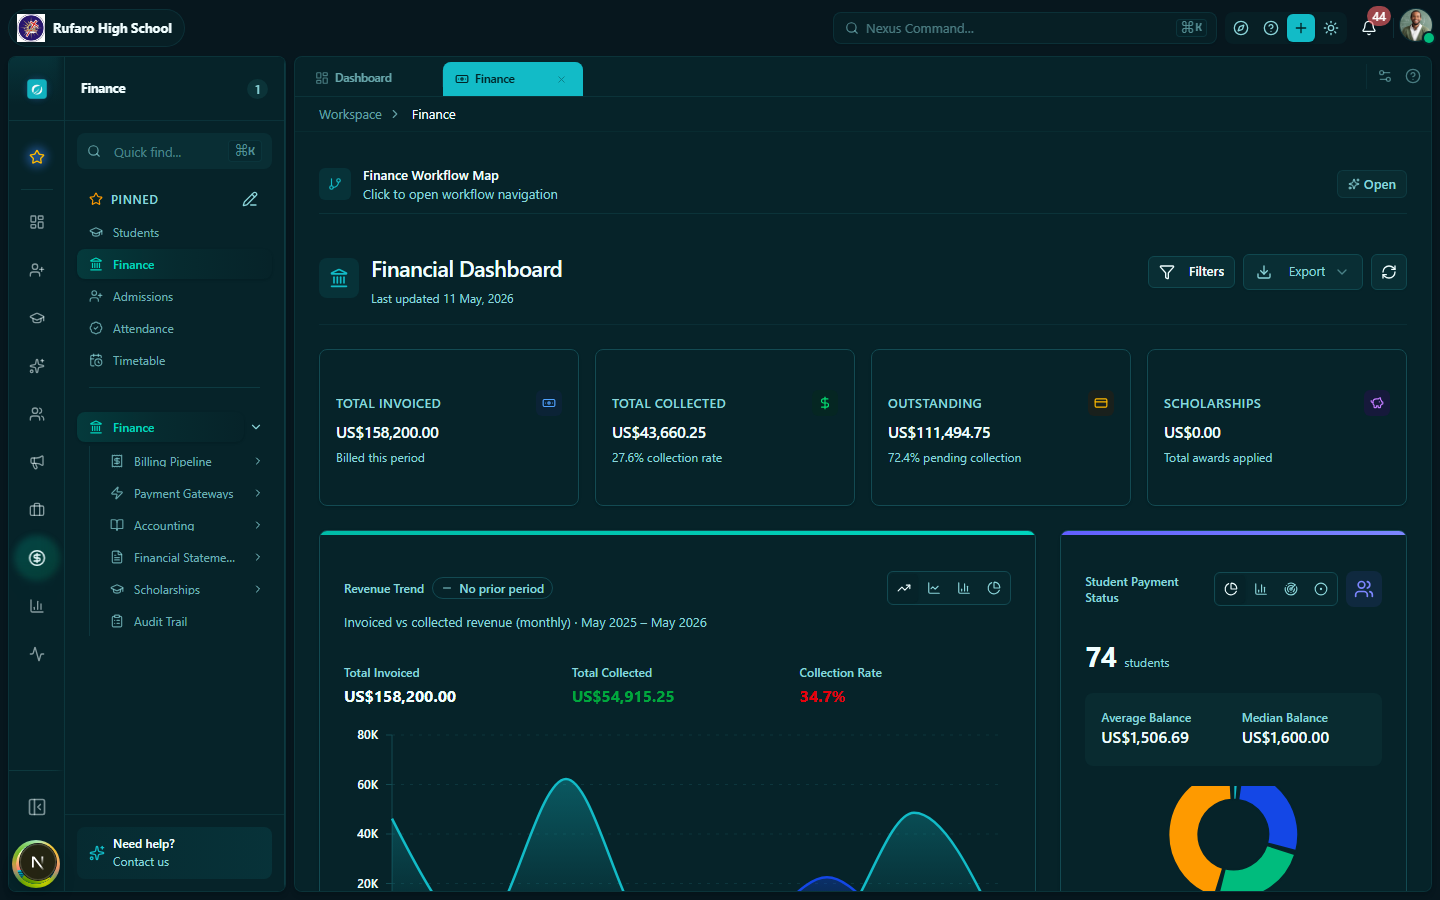
The Finance dashboard is the first screen you see when you open the Finance module. It gives you a real-time summary of your school's financial health — how much has been collected, what is still outstanding, and which students are overdue.
Navigation: Finance (main item in sidebar)
Finance dashboard
Collection overview cards
At the top of the dashboard you will find four summary cards:
| Card | What it shows |
|---|---|
| Total billed | Sum of all invoices issued in the current term / year |
| Total collected | Sum of all payments received against invoices |
| Outstanding | Total billed minus total collected |
| Collection rate | Percentage of billed amount that has been collected |
The collection rate gauge turns amber below 75% and red below 50%, making it easy to spot when action is needed.
Quick actions
The dashboard includes a set of quick-action buttons so you can jump to common tasks without navigating through sub-menus:
- Record payment — opens the payment recording form
- New billing run — shortcut to create a billing run
- View invoices — filters the invoice list to outstanding
- Generate receipt — opens the receipt issuing form
Recent payments
A table at the bottom of the dashboard shows the last 20 payment transactions with student name, amount, payment method, and timestamp.
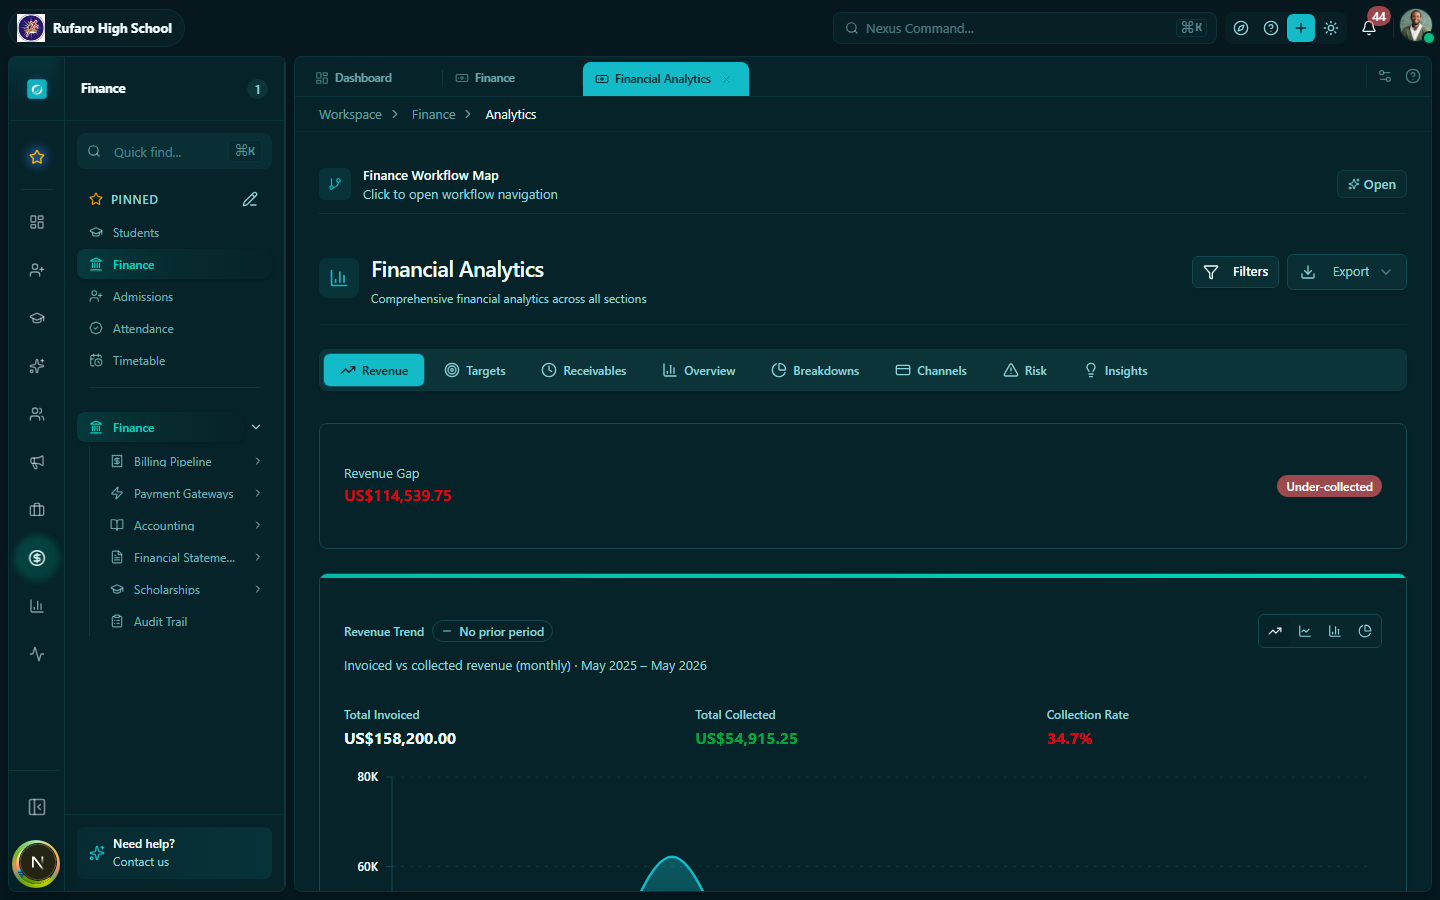
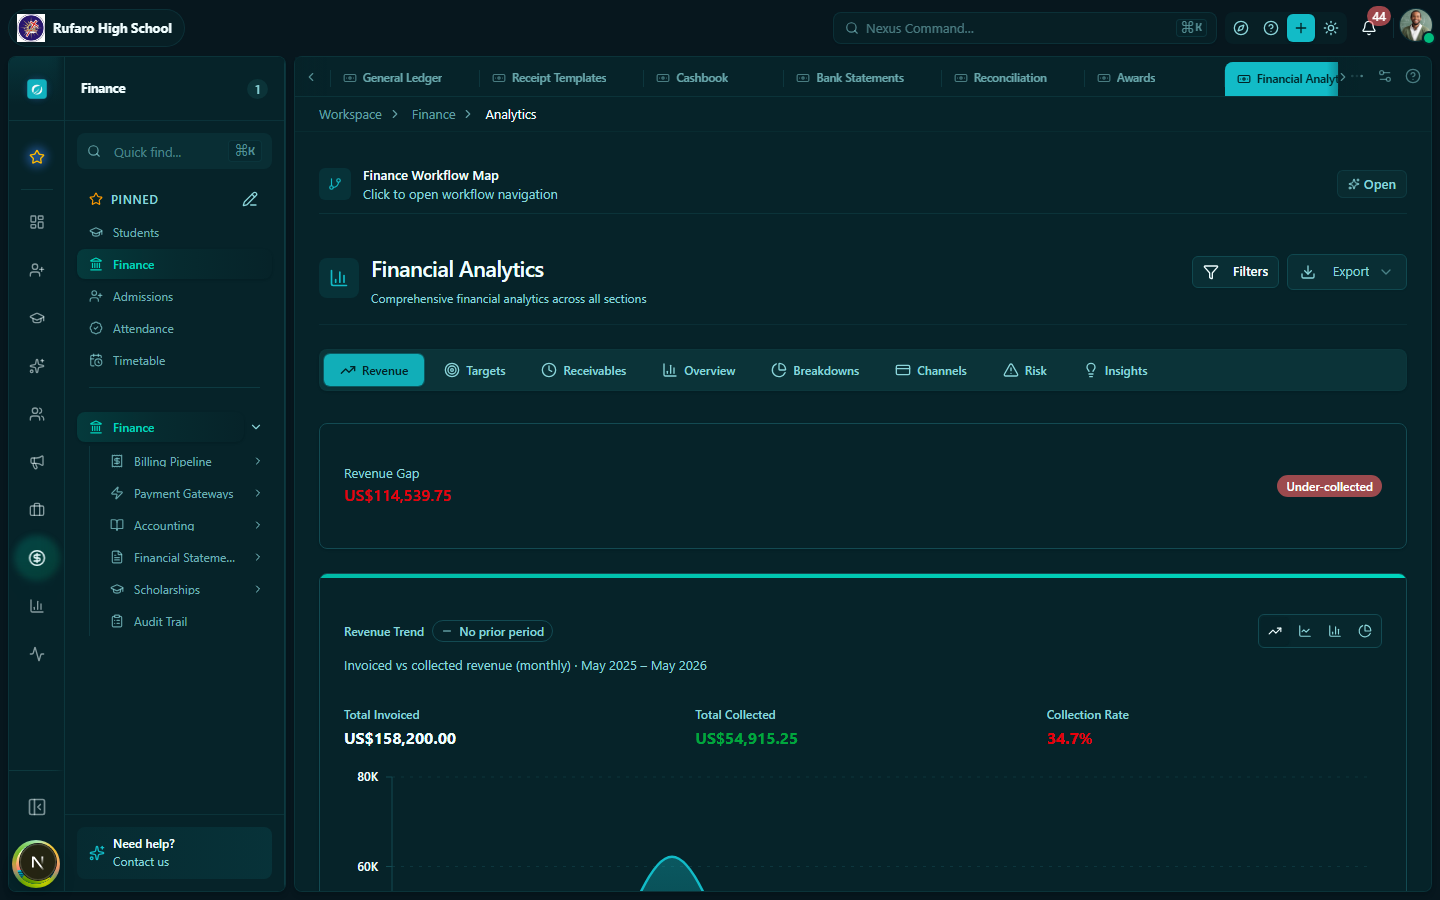
Analytics
Navigation: Finance → Analytics
The Analytics page provides deeper breakdowns of financial data across multiple tabs.
Overview tab
The Overview tab shows:
- Monthly collection trend chart (bar/line)
- Top 5 outstanding students by amount owed
- Fee type distribution pie chart (Tuition vs Transport vs Registration, etc.)
Revenue tab
The Revenue tab presents your top-line income metrics: total revenue collected, monthly breakdowns, and a running comparison against the prior term.
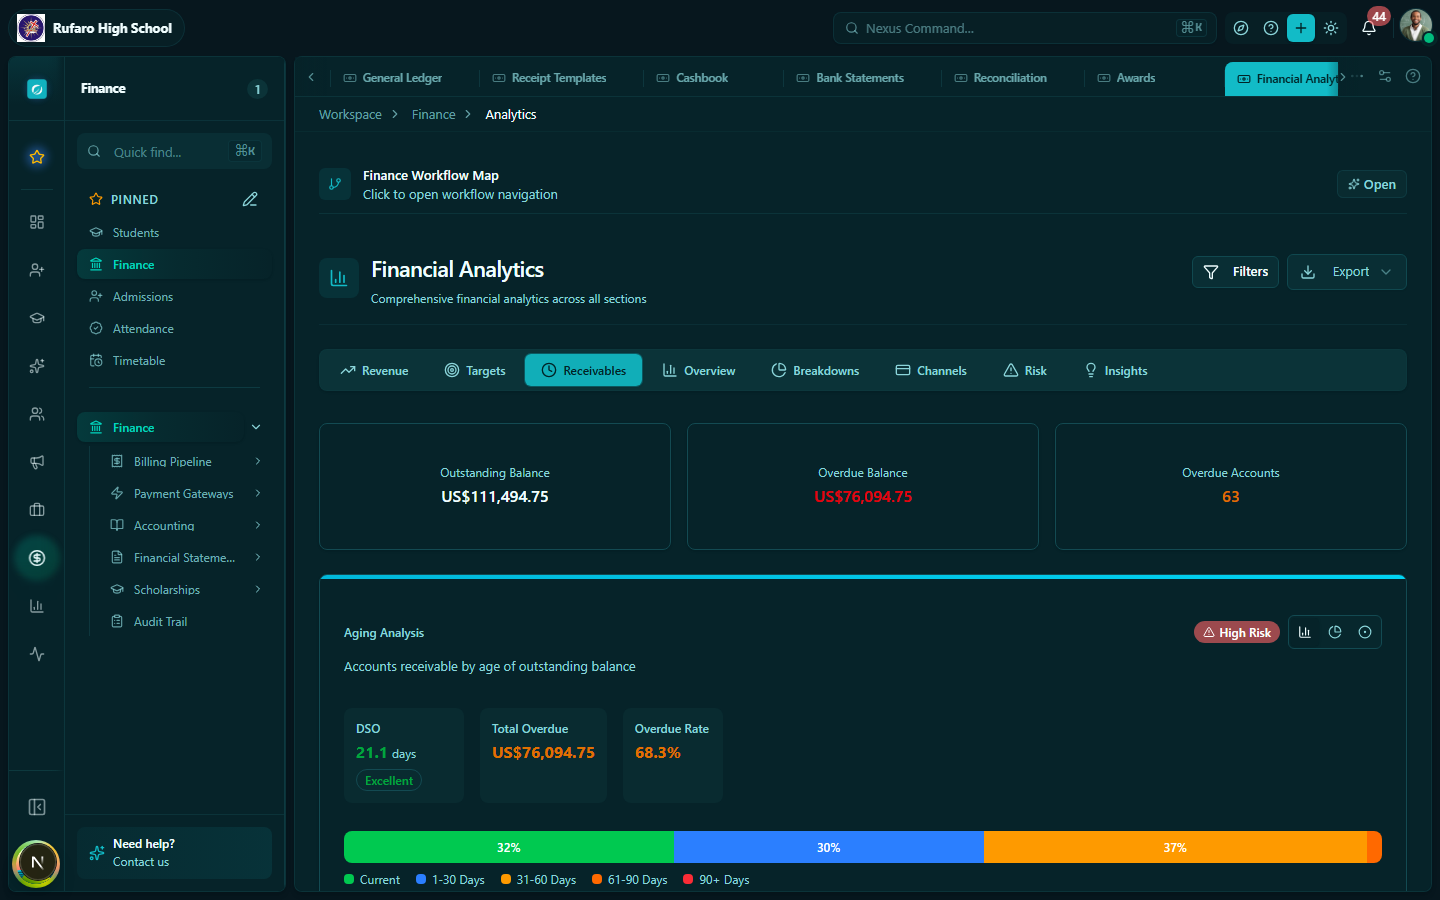
Receivables tab
The Receivables tab shows all outstanding amounts — who owes what and how long debts have been open. Use this to prioritise follow-up and calculate expected cash flow.
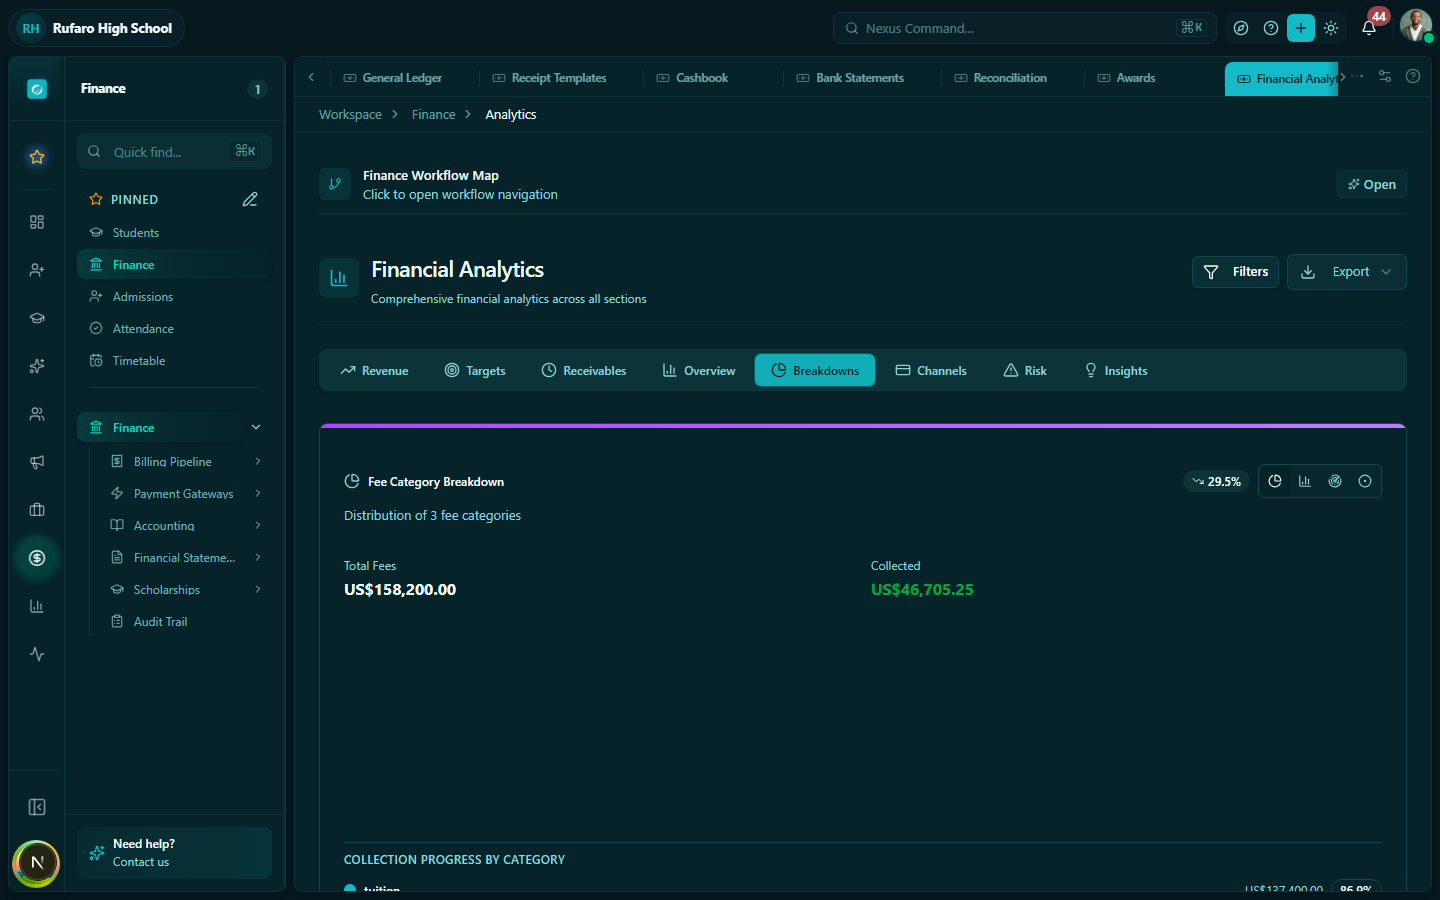
Breakdowns tab
The Breakdowns tab disaggregates collection data by grade level and fee category so you can spot which year groups or fee types have low collection rates.
| Column | Description |
|---|---|
| Grade | Grade level name |
| # Students | Number of enrolled students with invoices |
| Total billed | Sum of invoices for that grade |
| Collected | Amount paid |
| Outstanding | Remaining balance |
| Collection rate | % collected |
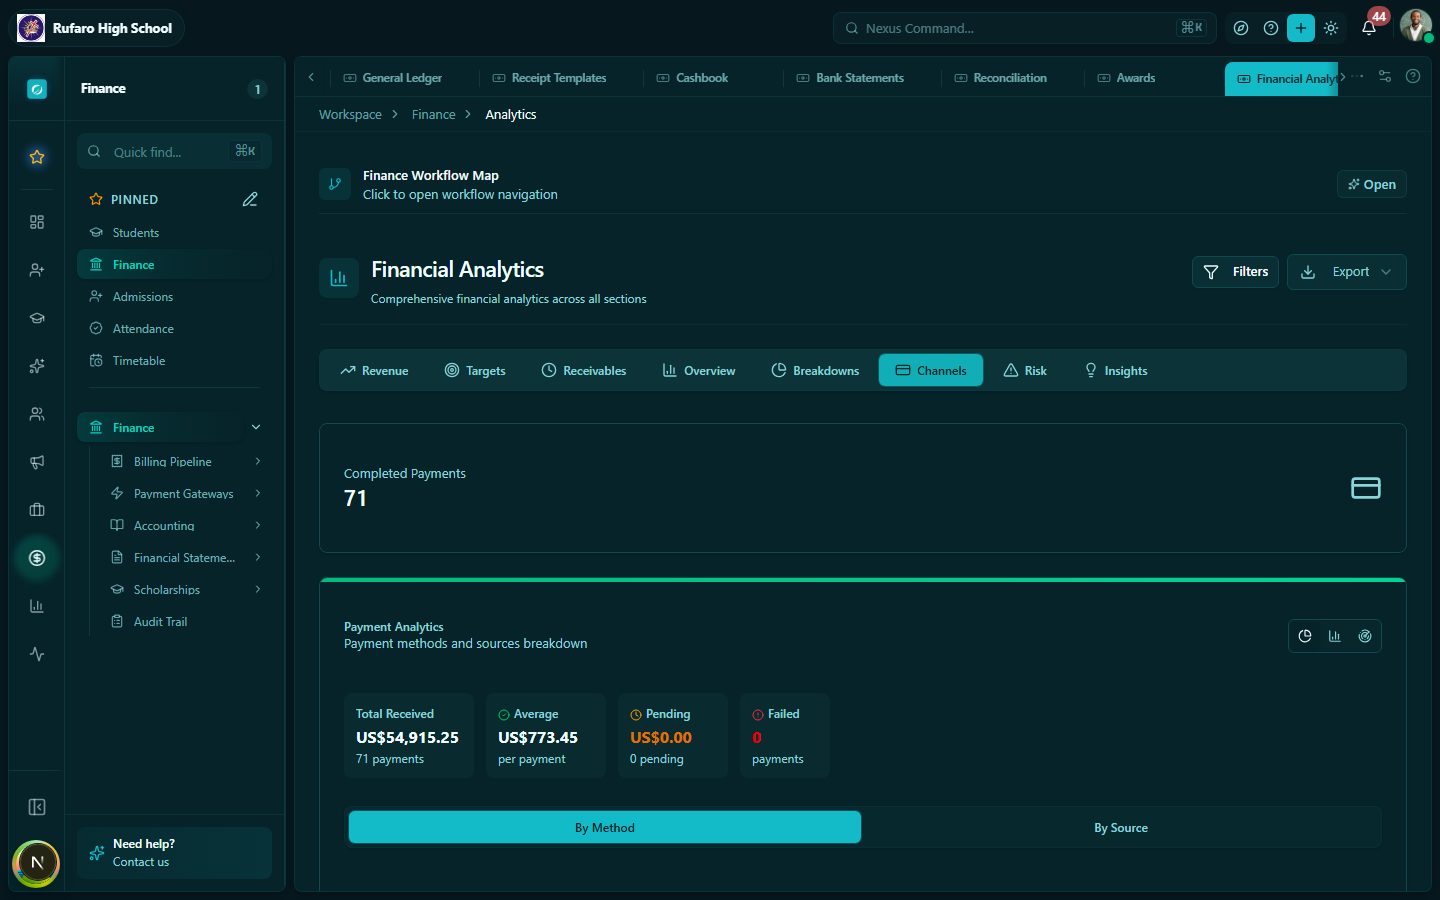
Channels tab
The Channels tab breaks payments down by payment method — Cash, Card (Stripe), PayNow, InnBucks, EcoCash, Bank Transfer — so you can see which channels parents prefer and optimise gateway coverage.
Targets tab
Shows progress against collection targets set for the current term or academic year. Each target displays a progress bar and a percentage attainment figure.
Risk tab
Flags students or grades that are at risk of defaulting based on payment history and current balance age. Use this to prioritise outreach before end-of-term deadlines.
Insights tab
AI-assisted summary of patterns detected in the data — unusually high outstanding balances, sudden drops in collection rate, or spikes in specific payment channels.
Filtering and date ranges
All analytics views respect the global academic year and term filters at the top of the page. You can also filter by:
- School (multi-school accounts only)
- Date range — custom start and end dates
- Grade level
Exporting analytics data
Click the Export button on any analytics tab to download the visible data as a CSV file. This is useful for sharing with the head teacher or uploading to a spreadsheet.
Tips for using the dashboard effectively
- Check the dashboard first thing each morning to see overnight online payments from PayNow or EcoCash.
- Use the By Grade view after each billing run to identify classes with low collection rates.
- Compare terms using the date range filter to spot seasonal patterns in payment behaviour.